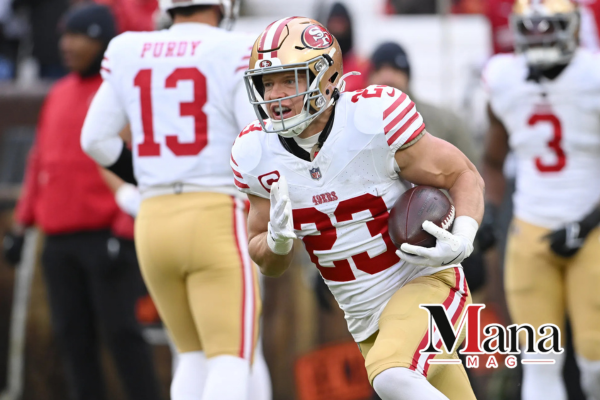
The San Francisco 49ers beat the Cleveland Browns 26-8 in their Week 13 matchup on November 30, 2025, at Huntington Bank Field. The final score suggests a comfortable San Francisco victory, but the team statistics tell a more interesting story.
Cleveland finished with 253 total yards, one more than San Francisco’s 252. The Browns also ran for 138 yards compared with 91 for the 49ers. Yet San Francisco controlled the areas that turned yards into points, especially third downs, turnovers, touchdowns and field position.
For readers looking for the 49ers vs Cleveland Browns match player stats, Brock Purdy completed 16 of 29 passes for 168 yards, one touchdown and no interceptions. Christian McCaffrey rushed for 53 yards and a touchdown, while George Kittle led San Francisco with 67 receiving yards.
Cleveland quarterback Shedeur Sanders completed 16 of 25 passes for 149 yards and one touchdown. Quinshon Judkins led the Browns’ rushing attack with 91 yards on 23 carries, while Harold Fannin Jr. caught the team’s only touchdown pass.
49ers vs Cleveland Browns Game Score
| Team | Q1 | Q2 | Q3 | Q4 | Final |
| San Francisco 49ers | 7 | 3 | 7 | 9 | 26 |
| Cleveland Browns | 0 | 8 | 0 | 0 | 8 |
San Francisco scored in every quarter. Cleveland’s only points came during the second quarter.
The Browns briefly took an 8-7 lead after Harold Fannin Jr.’s touchdown reception and a successful two-point conversion. San Francisco answered with a field goal before halftime and then pulled away in the second half.
Game Details
- Date: November 30, 2025
- Week: NFL Week 13
- Venue: Huntington Bank Field
- Final score: 49ers 26, Browns 8
- San Francisco record after game: 9-4
- Cleveland record after game: 3-9
49ers vs Browns Team Stats
| Category | 49ers | Browns |
| Total yards | 252 | 253 |
| Passing yards | 161 net | 115 net |
| Rushing yards | 91 | 138 |
| First downs | 19 | 15 |
| Third downs | 11/17 | 3/11 |
| Fourth downs | 0/0 | 0/4 |
| Turnovers lost | 0 | 2 |
| Offensive plays | 64 | 60 |
| Penalties | 3 | 4 |
| Penalty yards | 11 | 25 |
| Time of possession | 30:10 | 29:50 |
The most eye-catching number is total yardage. Cleveland actually gained one more yard than San Francisco.
The difference came from execution. The 49ers converted 11 of 17 third downs, while Cleveland converted only 3 of 11. San Francisco also avoided turnovers, while the Browns lost two fumbles.
San Francisco 49ers Player Stats
Brock Purdy Passing Stats
Brock Purdy completed 16 of 29 passes for 168 yards. He threw one touchdown and did not throw an interception.
| Statistic | Brock Purdy |
| Completions | 16 |
| Attempts | 29 |
| Passing yards | 168 |
| Completion rate | 55.2% |
| Passing TDs | 1 |
| Interceptions | 0 |
| Longest completion | 33 yards |
Purdy’s numbers were not built around a huge passing total. His main contribution came from avoiding turnovers and making enough plays to keep San Francisco’s offense moving.
He also rushed twice for four yards and scored a rushing touchdown.
Christian McCaffrey Rushing Stats
Christian McCaffrey carried the ball 20 times for 53 yards and one touchdown.
| Statistic | Christian McCaffrey |
| Carries | 20 |
| Rushing yards | 53 |
| Yards per carry | 2.7 |
| Longest run | 7 yards |
| Rushing TDs | 1 |
| Receptions | 4 |
| Receiving yards | 21 |
McCaffrey averaged only 2.7 yards per carry, but his workload remained high. He accounted for 20 of San Francisco’s 33 rushing attempts.
His four catches added another 21 yards, giving him 74 total yards from scrimmage.
Brian Robinson Jr. Rushing Stats
Brian Robinson Jr. was the second-leading 49ers rusher.
He carried eight times for 26 yards, averaging 3.3 yards per attempt. His longest run covered nine yards.
Brock Purdy added four rushing yards and one touchdown, while Demarcus Robinson and Mac Jones also recorded rushing attempts.
George Kittle Receiving Stats
George Kittle led San Francisco’s receiving group with 67 yards.
| Statistic | George Kittle |
| Receptions | 4 |
| Receiving yards | 67 |
| Yards per reception | 16.8 |
| Longest reception | 33 yards |
| Receiving TDs | 0 |
Kittle’s four catches produced the highest receiving total for either team.
His 33-yard reception was also San Francisco’s longest completed pass of the game.
Jauan Jennings Receiving Stats
Jauan Jennings finished with four receptions for 39 yards and one touchdown.
His touchdown gave San Francisco a much-needed scoring play in the fourth quarter as the 49ers extended their advantage.
Jennings and Kittle each caught four passes, while McCaffrey also recorded four receptions.
Other 49ers Receiving Numbers
Kyle Juszczyk caught two passes for 27 yards.
Christian McCaffrey added four receptions for 21 yards.
Ricky Pearsall caught two passes for 14 yards.
San Francisco finished with 16 completed passes for 168 receiving yards and one passing touchdown.
Cleveland Browns Player Stats
Shedeur Sanders Passing Stats
Shedeur Sanders completed 16 of 25 passes for 149 yards and one touchdown.
| Statistic | Shedeur Sanders |
| Completions | 16 |
| Attempts | 25 |
| Passing yards | 149 |
| Completion rate | 64.0% |
| Passing TDs | 1 |
| Interceptions | 0 |
| Longest completion | 34 yards |
Sanders did not throw an interception. Cleveland’s passing game still produced only 115 net passing yards after accounting for sacks.
Dillon Gabriel also attempted one pass for Cleveland.
Quinshon Judkins Rushing Stats
Quinshon Judkins was Cleveland’s leading rusher by a wide margin.
| Statistic | Quinshon Judkins |
| Carries | 23 |
| Rushing yards | 91 |
| Yards per carry | 4.0 |
| Longest run | 17 yards |
| Rushing TDs | 0 |
| Receptions | 3 |
| Receiving yards | 18 |
Judkins accounted for 91 of Cleveland’s 138 rushing yards.
He also caught three passes for 18 yards, giving him 109 total yards from scrimmage.
Dylan Sampson Adds Efficient Rushing
Dylan Sampson carried four times for 23 yards.
His 5.8 yards per carry was the best rushing average among Cleveland players with multiple carries.
Isaiah Bond and Malachi Corley each added nine rushing yards on one attempt. Sanders rushed once for six yards, while Fannin Jr. had one rushing attempt for no gain.
Harold Fannin Jr. Leads Cleveland Receivers
Harold Fannin Jr. led Cleveland’s receiving group and scored the Browns’ only touchdown.
| Statistic | Harold Fannin Jr. |
| Receptions | 3 |
| Receiving yards | 43 |
| Yards per reception | 14.3 |
| Longest reception | 34 yards |
| Receiving TDs | 1 |
Fannin’s 34-yard touchdown reception helped Cleveland take its only lead of the game during the second quarter.
Other Browns Receiving Stats
Jerry Jeudy finished with three catches for 26 yards.
Gage Larvadain had two receptions for 23 yards.
Quinshon Judkins caught three passes for 18 yards.
Isaiah Bond recorded one catch for 18 yards.
Jerome Ford caught three passes for 17 yards.
David Njoku finished with two receptions for four yards.
The Rushing Battle Was Won by Cleveland
One of the more unusual parts of the game was Cleveland’s rushing advantage.
The Browns ran for 138 yards on 31 attempts. San Francisco recorded 91 rushing yards on 33 attempts.
That gave Cleveland a 47-yard advantage on the ground.
Judkins alone matched San Francisco’s entire team rushing total with 91 yards.
Despite that advantage, Cleveland failed to score a rushing touchdown. San Francisco scored twice on the ground, once through McCaffrey and once through Purdy.
Why the Rushing Advantage Did Not Matter
Running the ball well does not automatically produce points.
Cleveland moved the ball between the 20-yard lines but struggled to finish drives. The Browns converted only 3 of 11 third downs and went 0-for-4 on fourth down.
San Francisco was much better at keeping drives alive.
That difference helped explain why the 49ers scored 26 points despite gaining fewer rushing yards.
Third-Down Efficiency Was a Major Difference
Third-down performance was one of the clearest separators.
San Francisco converted 11 of 17 third-down attempts.
Cleveland converted only 3 of 11.
That means the 49ers converted 64.7% of their third downs, compared with 27.3% for the Browns.
The difference was 37.4 percentage points.
Third-down conversions give an offense extra plays and more chances to reach scoring range. San Francisco repeatedly kept possessions alive while Cleveland struggled to do the same.
Turnovers Hurt Cleveland
The 49ers finished the game without losing a turnover.
Cleveland lost two fumbles.
Neither team threw an interception.
| Turnover category | 49ers | Browns |
| Interceptions thrown | 0 | 0 |
| Fumbles lost | 0 | 2 |
| Total turnovers lost | 0 | 2 |
The two lost fumbles gave San Francisco additional opportunities and helped create better field position.
In a game decided by 18 points, those extra possessions mattered.
Special Teams Helped the 49ers
Special teams also played a role in the result.
Skyy Moore returned three punts for 69 yards, including a 66-yard return. He averaged 23 yards per punt return.
San Francisco’s return game therefore produced 66 more punt-return yards than Cleveland’s.
Matt Gay also made both of his field-goal attempts and both extra-point attempts.
Field Position Made a Difference
A long punt return can change where an offense begins a possession.
Moore’s 66-yard return gave San Francisco excellent field position and helped the 49ers put pressure on the Cleveland defense.
Cleveland’s return game produced only three punt-return yards.
That 66-yard difference did not appear in the basic passing or rushing totals, but special teams still helped shape the game.
Quarter-by-Quarter Breakdown
First Quarter
San Francisco scored the only points of the opening quarter.
McCaffrey finished the opening scoring drive with a one-yard rushing touchdown.
The 49ers led 7-0 after the first 15 minutes.
Second Quarter
Cleveland responded in the second quarter.
Sanders connected with Fannin Jr. for a 34-yard touchdown. Cleveland then converted the two-point attempt to take an 8-7 lead.
San Francisco answered with a field goal before halftime and went into the break ahead 10-8.
Third Quarter
San Francisco regained control in the third quarter.
Purdy scored on a two-yard rushing touchdown, pushing the 49ers’ lead to 17-8.
Cleveland failed to score during the quarter.
Fourth Quarter
The 49ers finished strongly.
Purdy connected with Jennings for a seven-yard touchdown, and Gay later added another field goal.
San Francisco scored nine points in the fourth quarter and completed the 26-8 victory.
49ers vs Browns Player Comparison
Brock Purdy vs Shedeur Sanders
Purdy finished with more passing yards, 168 to 149.
Sanders had the higher completion percentage, completing 64% of his attempts compared with Purdy’s 55.2%.
Both quarterbacks threw one touchdown and no interceptions.
The key difference was what happened around the quarterbacks. San Francisco converted third downs at a much higher rate and scored three touchdowns.
Christian McCaffrey vs Quinshon Judkins
Judkins had the better rushing numbers.
He gained 91 yards on 23 carries, while McCaffrey gained 53 yards on 20 attempts.
McCaffrey still scored a rushing touchdown and added 21 receiving yards.
Judkins gained more rushing yards, but San Francisco’s offense produced more points.
George Kittle vs Harold Fannin Jr.
Kittle led all players in receiving yardage with 67 yards.
Fannin Jr. had 43 receiving yards and scored Cleveland’s only touchdown.
Kittle produced more yardage, while Fannin provided the bigger scoring play for his team.
What the 49ers vs Cleveland Browns Match Player Stats Tell Us
The final score does not tell the entire story.
Cleveland gained 253 yards. San Francisco gained 252.
Cleveland also ran for 138 yards, 47 more than the 49ers.
Yet San Francisco won 26-8.
The difference came from execution in high-value situations.
The 49ers:
- Converted 11 of 17 third downs.
- Lost zero turnovers.
- Scored three touchdowns.
- Made both field-goal attempts.
- Scored in all four quarters.
- Generated 69 punt-return yards.
The Browns:
- Converted only 3 of 11 third downs.
- Lost two fumbles.
- Went 0-for-4 on fourth down.
- Scored only once after halftime.
- Produced only eight total points.
This is why the 49ers vs Cleveland Browns match player stats need to be viewed alongside team efficiency numbers. A player can produce strong yardage numbers while the offense still struggles to score.
Key Takeaways From the Game
San Francisco Won the Situational Battle
The 49ers did not dominate every statistical category.
They did dominate the categories that produced points.
Third downs, turnovers, scoring drives and special teams all favored San Francisco.
Cleveland’s Running Game Was Productive
Judkins and the Browns’ rushing attack performed well.
The team averaged 4.5 yards per rushing attempt and finished with 138 yards.
The issue was converting those yards into touchdowns.
Purdy Protected the Football
Purdy did not throw an interception.
That helped San Francisco avoid giving Cleveland short fields through passing turnovers.
McCaffrey Still Had a Large Workload
His 2.7-yard rushing average was modest, but 20 carries plus four receptions gave him 24 touches.
He also scored a touchdown.
Kittle Was San Francisco’s Top Receiver
Kittle’s 67 receiving yards led the 49ers.
Jennings supplied the team’s passing touchdown.
Final Score and Player Stats Summary
The San Francisco 49ers defeated the Cleveland Browns 26-8 on November 30, 2025.
The top individual numbers included:
- Brock Purdy: 16/29, 168 passing yards, 1 passing TD, 0 INT
- Christian McCaffrey: 20 carries, 53 rushing yards, 1 rushing TD
- George Kittle: 4 receptions, 67 yards
- Jauan Jennings: 4 receptions, 39 yards, 1 TD
- Shedeur Sanders: 16/25, 149 passing yards, 1 TD, 0 INT
- Quinshon Judkins: 23 carries, 91 rushing yards
- Harold Fannin Jr.: 3 receptions, 43 yards, 1 TD
The team numbers add more context. Cleveland gained one more total yard than San Francisco, but the 49ers were much better on third down and did not lose a turnover.
For anyone searching for the 49ers vs Cleveland Browns match player stats, the main lesson from this game is simple: yardage alone does not determine the winner. San Francisco turned its possessions into points far more effectively, and that difference produced the 26-8 result.
Frequently Asked Questions
What was the final score between the 49ers and Browns?
The San Francisco 49ers defeated the Cleveland Browns 26-8 on November 30, 2025, at Huntington Bank Field.
Who was the leading passer in the 49ers vs Browns game?
Brock Purdy led the game with 168 passing yards. He completed 16 of 29 passes, threw one touchdown and had no interceptions.
How many rushing yards did Quinshon Judkins have?
Quinshon Judkins rushed for 91 yards on 23 carries. He averaged 4.0 yards per carry.
How many rushing yards did Christian McCaffrey have?
Christian McCaffrey rushed for 53 yards on 20 carries and scored one rushing touchdown. He also caught four passes for 21 yards.
Who led the 49ers in receiving?
George Kittle led San Francisco with 67 receiving yards on four catches. His longest reception covered 33 yards.
Who scored the Browns’ only touchdown?
Harold Fannin Jr. caught Cleveland’s only touchdown. His reception covered 34 yards.
Did Shedeur Sanders throw an interception?
No. Sanders completed 16 of 25 passes for 149 yards, one touchdown and zero interceptions.
Which team had more total yards?
Cleveland had 253 total yards, while San Francisco had 252. The Browns therefore finished with one more total yard despite losing 26-8.
Which team had more rushing yards?
Cleveland had 138 rushing yards. San Francisco had 91.
Why did the 49ers win despite having fewer rushing yards?
San Francisco was much better on third downs, converting 11 of 17 attempts compared with Cleveland’s 3 of 11. The 49ers also lost no turnovers, while Cleveland lost two fumbles.
How many turnovers did each team lose?
San Francisco lost zero turnovers. Cleveland lost two fumbles. Neither team threw an interception.
How did the 49ers perform on third down?
San Francisco converted 11 of 17 third-down attempts, a 64.7% conversion rate.
How did the Browns perform on third down?
Cleveland converted 3 of 11 third-down attempts, a 27.3% rate.
When did the 49ers play the Browns?
The matchup took place on Sunday, November 30, 2025, during Week 13 of the NFL season.
Where was the game played?
The game was played at Huntington Bank Field in Cleveland, Ohio.
Who had the most receiving yards in the game?
George Kittle led all players with 67 receiving yards.

Must See
-


Sports
/ 2 months agoLos Angeles Chargers vs Detroit Lions Match Player Stats: 2025 Hall of Fame Game
The Los Angeles Chargers defeated the Detroit Lions 34-7 in the 2025 NFL Hall...
By Magzine -


Sports
/ 2 months agoPittsburgh Pirates vs Mets Match Player Stats: August 2026 Game Breakdown
The Pittsburgh Pirates and New York Mets produced two very different games during their...
By Magzine -


Sports
/ 2 months agoGolden State Warriors vs Orlando Magic Match Player Stats, Box Score and Game Analysis
The Golden State Warriors beat the Orlando Magic 120-97 on December 22, 2025, at...
By Magzine