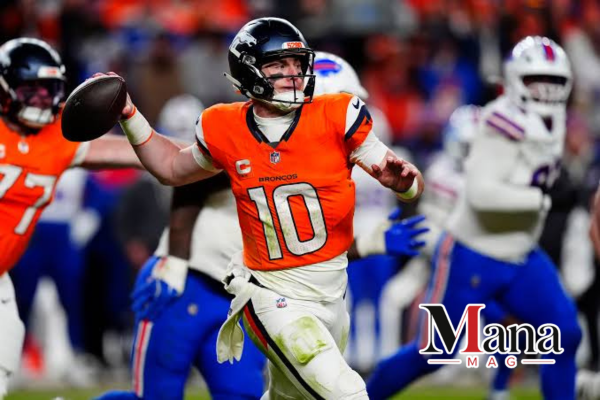
The Buffalo Bills and Denver Broncos played one of the closest AFC playoff games of the 2025 season on January 17, 2026, at Empower Field at Mile High. Denver won 33-30 in overtime after Wil Lutz converted a 23-yard field goal.
The final score tells only part of the story. Buffalo finished with 449 total yards compared with Denver’s 349, and the Bills produced 183 rushing yards. Denver still found a way to win through turnovers, pass rush, quarterback protection, and field-goal accuracy. The official NFL game book confirms the major team and player statistics from the matchup.
For anyone searching for Buffalo Bills vs Denver Broncos match player stats, the key numbers include Josh Allen’s 283 passing yards and three touchdowns, Bo Nix’s 279 passing yards and three touchdowns, James Cook’s 117 rushing yards, and Marvin Mims Jr.’s 93 receiving yards and one touchdown.
Buffalo Bills vs Denver Broncos Final Score
| Team | Q1 | Q2 | Q3 | Q4 | OT | Final |
| Buffalo Bills | 7 | 3 | 7 | 13 | 0 | 30 |
| Denver Broncos | 3 | 17 | 3 | 7 | 3 | 33 |
Denver opened the scoring with a Wil Lutz field goal. Buffalo answered with a Mecole Hardman touchdown late in the first quarter.
The Broncos then created separation in the second quarter, taking a 20-10 lead into halftime. Buffalo fought back and moved ahead 27-23 in the fourth quarter.
Denver responded with a 26-yard touchdown pass from Bo Nix to Marvin Mims Jr. With five seconds left in regulation, Matt Prater hit a 50-yard field goal to tie the game.
The Broncos received the ball in overtime but eventually punted. Buffalo then turned the ball over on a Josh Allen interception. Denver moved into field-goal range after defensive pass interference penalties and Lutz finished the game with the winning kick.
Josh Allen vs Bo Nix: Quarterback Stats
The quarterback comparison was close in passing yardage, but the supporting numbers tell a different story.
| Statistic | Josh Allen | Bo Nix |
| Completions | 25 | 26 |
| Attempts | 39 | 46 |
| Completion rate | 64.1% | 56.5% |
| Passing yards | 283 | 279 |
| Yards per attempt | 7.3 | 6.1 |
| Passing TDs | 3 | 3 |
| Interceptions | 2 | 1 |
| Sacks | 3 | 0 |
| Rushing yards | 66 | 29 |
| Passer rating | 90.0 | 87.1 |
Allen completed a higher percentage of his throws and finished with four more passing yards. He also added 66 rushing yards, giving him another way to move the offense.
Nix attempted seven more passes than Allen and finished only four yards behind him. The biggest difference came in protection. Denver allowed zero sacks, while Allen was sacked three times for 17 yards. The official NFL statistics also show Denver recording 10 quarterback hits compared with three for Buffalo.
Nix also threw three touchdown passes, matching Allen’s total. That helped Denver compensate for its much weaker rushing production.
Josh Allen’s Full Performance
Josh Allen completed 25 of 39 attempts for 283 yards, three touchdowns, and two interceptions.
His three touchdown passes went to Mecole Hardman Jr., Keon Coleman, and Dalton Kincaid. Allen also ran 12 times for 66 yards, with a long run of 26 yards.
His overall production was strong, but turnovers hurt Buffalo.
Allen lost two of Buffalo’s three lost fumbles and also threw two interceptions. Denver’s defense repeatedly forced the Bills into difficult situations.
Allen’s numbers show why the game stayed competitive. He produced 349 combined passing and rushing yards and helped Buffalo generate 449 total offensive yards.
The problem was possession efficiency. Denver turned Buffalo’s mistakes into additional opportunities.
Bo Nix’s Full Performance
Bo Nix completed 26 of 46 passes for 279 yards, three touchdowns, and one interception.
He also ran 12 times for 29 yards. Unlike Allen, Nix did not contribute much on the ground, but Denver protected him extremely well.
Nix’s three touchdown passes went to Frank Crum, Lil’Jordan Humphrey, and Marvin Mims Jr.
His final completion rate of 56.5% was lower than Allen’s 64.1%. His passer rating was also slightly lower.
Still, Nix avoided the negative plays that hurt Buffalo. He was not sacked once despite attempting 46 passes.
That protection allowed Denver to keep throwing throughout the game.
James Cook Led Buffalo’s Rushing Attack
James Cook was Buffalo’s leading rusher.
He carried the ball 24 times for 117 yards, averaging 4.9 yards per carry. His longest run covered 24 yards.
Cook produced roughly 64% of Buffalo’s 183 rushing yards. He also caught two passes for 24 yards, giving him 141 combined rushing and receiving yards.
Allen added another 66 rushing yards, meaning Cook and Allen accounted for all 183 of Buffalo’s listed rushing yards.
That was one of the biggest statistical advantages for Buffalo.
Buffalo Bills Receiving Stats
Dalton Kincaid led the Bills in receiving yards.
| Player | Receptions | Yards | TD | Long |
| Dalton Kincaid | 6 | 83 | 1 | 25 |
| Khalil Shakir | 7 | 75 | 0 | 46 |
| Ray Davis | 2 | 33 | 0 | 24 |
| Dawson Knox | 3 | 32 | 0 | 13 |
| Brandin Cooks | 2 | 20 | 0 | 15 |
| Keon Coleman | 1 | 10 | 1 | 10 |
| Mecole Hardman Jr. | 1 | 4 | 1 | 4 |
| Curtis Samuel | 1 | 2 | 0 | 2 |
The official game book lists Kincaid with six catches for 83 yards and one touchdown. Shakir added seven catches for 75 yards, including a 46-yard reception.
Kincaid was particularly efficient. He caught all six of his listed targets for 83 yards.
Shakir provided the biggest explosive play among Buffalo’s receivers with his 46-yard catch.
Keon Coleman and Mecole Hardman produced touchdowns despite recording limited yardage. That shows why receiving yards alone do not explain a player’s impact.
Denver Broncos Receiving Stats
Marvin Mims Jr. led Denver’s receiving group.
| Player | Receptions | Yards | TD | Long |
| Marvin Mims Jr. | 8 | 93 | 1 | 27 |
| Courtland Sutton | 4 | 53 | 0 | 25 |
| Lil’Jordan Humphrey | 2 | 33 | 1 | 29 |
| Frank Crum | 1 | 7 | 1 | 7 |
Mims caught eight passes for 93 yards and a touchdown. His late fourth-quarter touchdown gave Denver a 30-27 lead with less than a minute remaining.
Sutton finished with four receptions for 53 yards. His biggest contribution came during Denver’s late touchdown drive, when he made several important catches to move the Broncos downfield.
Humphrey and Crum each caught touchdown passes from Nix. That gave Denver three different receiving touchdown scorers.
Buffalo Bills Rushing Stats
Buffalo dominated the ground game.
| Player | Carries | Yards | Average | Long | TD |
| James Cook | 24 | 117 | 4.9 | 24 | 0 |
| Josh Allen | 12 | 66 | 5.5 | 26 | 0 |
| Bills total | 36 | 183 | 5.1 | 26 | 0 |
Buffalo averaged 5.1 yards per rushing attempt. Denver averaged only 3.2.
The 113-yard difference in rushing production was one of the largest statistical advantages of the game.
Yet Buffalo did not score a rushing touchdown. That matters because the Bills’ strong ground production did not create the same scoring advantage that their yardage suggested.
Denver Broncos Rushing Stats
Denver struggled to run the ball consistently.
| Player | Carries | Yards | Average | Long | TD |
| Bo Nix | 12 | 29 | 2.4 | 11 | 0 |
| Jaleel McLaughlin | 4 | 21 | 5.3 | 13 | 0 |
| RJ Harvey | 6 | 20 | 3.3 | 12 | 0 |
| Broncos total | 22 | 70 | 3.2 | 13 | 0 |
No Denver runner reached 30 rushing yards.
That put more pressure on Nix and the passing game. Denver responded by throwing 46 passes, seven more than Buffalo.
Team Stats: Bills vs Broncos
| Category | Buffalo Bills | Denver Broncos |
| Total yards | 449 | 349 |
| Passing yards | 283 gross | 279 |
| Net passing yards | 266 | 279 |
| Rushing yards | 183 | 70 |
| First downs | 28 | 22 |
| Offensive plays | 78 | 68 |
| Third down | 10/15 | 8/16 |
| Fourth down | 1/1 | 1/1 |
| Turnovers from lost fumbles | 3 | 0 |
| Interceptions thrown | 2 | 1 |
| Sacks allowed | 3 | 0 |
| Field goals | 3 | 4 |
| Time of possession | 40:58 | 29:18 |
| Red-zone efficiency | 3/5 | 1/4 |
Buffalo controlled possession for almost 41 minutes and ran 10 more offensive plays.
The Bills also converted 66.7% of their third downs compared with Denver’s 50%.
Those numbers normally point toward a Buffalo win. Denver’s advantage came in turnovers, pressure, protection, and kicking.
Why Denver Won Despite Being Outgained
This is the most interesting part of the Buffalo Bills vs Denver Broncos match player stats.
Buffalo finished with 449 total yards. Denver had 349.
Buffalo also dominated rushing production, first downs, time of possession, and third-down efficiency.
Denver still won because several high-impact categories went in the Broncos’ favor.
Denver protected Bo Nix
The Broncos allowed zero sacks.
Buffalo’s defense recorded three quarterback hits, but no sacks. Nix was able to attempt 46 passes without losing yardage to sacks.
Denver pressured Josh Allen
The Broncos recorded three sacks and 10 quarterback hits.
Allen was sacked three times for a 17-yard loss.
That difference gave Denver a clear edge in quarterback disruption.
Turnovers hurt Buffalo
Buffalo committed five fumbles and lost three.
Denver had one fumble and recovered it.
Allen also threw two interceptions, while Nix threw one. Denver finished with two defensive interceptions compared with Buffalo’s one.
The turnover difference helped Denver gain extra possessions despite having less offensive yardage.
Denver was better on field goals
Wil Lutz made all four of his field-goal attempts.
Matt Prater made all three of his attempts.
Lutz scored 15 points through four field goals and three extra points. Prater scored 12 points through three field goals and three extra points.
In a three-point overtime win, one extra made field goal matters.
Defensive Player Stats
Denver’s defense produced the stronger pass-rush numbers.
The Broncos recorded three sacks, 10 quarterback hits, four tackles for loss, two interceptions, and two passes defended.
Nik Bonitto recorded a sack and forced two fumbles according to the official defensive statistics. Malcolm Roach and Zach Allen also contributed to Denver’s pressure.
P.J. Locke recorded one of Denver’s interceptions and returned the ball 30 yards.
Ja’Quan McMillian recorded the other Denver interception. His overtime interception of Allen ended Buffalo’s possession and gave Denver the chance to win.
For Buffalo, Deone Walker recorded the Bills’ only interception. Christian Benford also recorded a forced fumble, while Cam Lewis finished with 10 combined tackles.
Special Teams Stats
Special teams played a direct role in the final result.
Wil Lutz:
- 4 field goals made on 4 attempts
• Long field goal: 50 yards
• 3 extra points
• 15 total points
Matt Prater:
- 3 field goals made on 3 attempts
• Long field goal: 50 yards
• 3 extra points
• 12 total points
Denver also received strong punting from Jeremy Crawshaw, who averaged 47.0 yards on four punts, with a long of 65 yards. Two of his punts landed inside the 20-yard line.
The Biggest Statistical Difference
The most striking contrast was this:
Buffalo had more yards.
Denver had more takeaways.
Buffalo rushed for 183 yards compared with Denver’s 70. The Bills also gained 449 total yards compared with 349 for the Broncos.
But Buffalo lost three fumbles and threw two interceptions.
Denver lost no fumbles and threw one interception.
Denver also recorded three sacks while Buffalo recorded none.
That combination explains why a team with 100 fewer total yards could still win by three points.
Buffalo Bills vs Denver Broncos Player Comparison
| Player | Key production |
| Josh Allen | 25/39, 283 pass yards, 3 TD, 2 INT, 66 rush yards |
| Bo Nix | 26/46, 279 pass yards, 3 TD, 1 INT, 29 rush yards |
| James Cook | 24 carries, 117 yards, 4.9 average |
| Marvin Mims Jr. | 8 receptions, 93 yards, 1 TD |
| Dalton Kincaid | 6 receptions, 83 yards, 1 TD |
| Khalil Shakir | 7 receptions, 75 yards |
| Courtland Sutton | 4 receptions, 53 yards |
| Wil Lutz | 4/4 field goals, 15 points |
The individual numbers show a close offensive contest.
Allen had the better completion rate and slightly more passing yards. Nix had more attempts and avoided sacks.
Cook was the game’s leading rusher. Mims was Denver’s top receiver. Kincaid led Buffalo in receiving yards.
Lutz had a perfect kicking night and supplied the final three points.
What the Box Score Says About Buffalo
Buffalo’s offense produced enough yardage to win.
The Bills gained 449 total yards, rushed for 183, passed for 283 gross yards, and converted 10 of 15 third downs.
James Cook was highly productive. Allen added substantial rushing yardage. Kincaid and Shakir both produced strong receiving numbers.
The major issue was possession security.
Three lost fumbles and two interceptions gave Denver too many opportunities. Buffalo also failed to record a sack against Nix.
The Bills therefore had the better volume numbers but failed to turn that production into a decisive scoring margin.
What the Box Score Says About Denver
Denver’s numbers look less impressive at first glance.
The Broncos had fewer yards, fewer first downs, fewer offensive plays, and much less rushing production.
But the Broncos were strong in the areas that directly affected the outcome.
They allowed no sacks. They recorded three sacks. They produced 10 quarterback hits. They intercepted Allen twice and lost no fumbles.
Lutz also converted four field goals.
That is how Denver overcame Buffalo’s 100-yard advantage in total offense and 113-yard advantage on the ground.
Final Takeaway From the Bills vs Broncos Player Stats
The January 17, 2026 AFC Divisional Round matchup shows why a football box score needs context.
Buffalo won the rushing battle by a wide margin. The Bills also produced more total yards, more first downs, better third-down efficiency, and more time of possession.
Denver won the game.
The difference came from turnovers, pass protection, quarterback pressure, and field goals. Buffalo lost three fumbles and threw two interceptions. Denver allowed no sacks and made four field goals.
Josh Allen still produced 283 passing yards, three touchdowns, and 66 rushing yards. Bo Nix answered with 279 passing yards and three touchdowns without taking a sack.
James Cook led all rushers with 117 yards, while Marvin Mims Jr. led Denver’s receivers with 93 yards and a touchdown. Dalton Kincaid led Buffalo’s receiving group with 83 yards and a touchdown.
The final score was 33-30, but the deeper story sits in the turnovers and pressure statistics. Those numbers explain how Denver survived a game in which Buffalo controlled much of the traditional yardage battle.
FAQ
Who won the Buffalo Bills vs Denver Broncos playoff game?
The Denver Broncos defeated the Buffalo Bills 33-30 in overtime on January 17, 2026, at Empower Field at Mile High.
How many passing yards did Josh Allen have against Denver?
Josh Allen completed 25 of 39 passes for 283 yards, three touchdowns, and two interceptions.
How many passing yards did Bo Nix have against Buffalo?
Bo Nix completed 26 of 46 passes for 279 yards, three touchdowns, and one interception.
Who led the Buffalo Bills in rushing?
James Cook led Buffalo with 117 rushing yards on 24 carries. He averaged 4.9 yards per carry and had a 24-yard long run.
Who was Denver’s leading receiver?
Marvin Mims Jr. led Denver with eight receptions for 93 yards and one touchdown.
How many rushing yards did the Bills have?
Buffalo finished with 183 rushing yards on 36 attempts, averaging 5.1 yards per carry.
How many rushing yards did the Broncos have?
Denver finished with 70 rushing yards on 22 attempts, averaging 3.2 yards per carry.
Which team had more total yards?
Buffalo had more total yards. The Bills finished with 449 yards, while Denver finished with 349.
How many turnovers did the Bills have?
Buffalo lost three fumbles and threw two interceptions. Denver lost no fumbles and threw one interception.
How many sacks did Denver record?
Denver recorded three sacks against Josh Allen. Buffalo recorded zero sacks against Bo Nix.
Who kicked the game-winning field goal?
Wil Lutz kicked the game-winning 23-yard field goal in overtime for Denver.
What was the biggest reason Denver won?
The biggest factors were Denver’s turnover advantage, pass rush, quarterback protection, and perfect 4-for-4 field-goal performance. Buffalo produced more yardage but gave Denver extra opportunities through turnovers.

Must See
-


Sports
/ 2 months agoLos Angeles Chargers vs Detroit Lions Match Player Stats: 2025 Hall of Fame Game
The Los Angeles Chargers defeated the Detroit Lions 34-7 in the 2025 NFL Hall...
By Magzine -


Sports
/ 2 months agoPittsburgh Pirates vs Mets Match Player Stats: August 2026 Game Breakdown
The Pittsburgh Pirates and New York Mets produced two very different games during their...
By Magzine -


Sports
/ 2 months agoGolden State Warriors vs Orlando Magic Match Player Stats, Box Score and Game Analysis
The Golden State Warriors beat the Orlando Magic 120-97 on December 22, 2025, at...
By Magzine